
This is a chart analysis using the same data from the previous COVID-19 paper1 to focus specifically on the state of Florida and further focus on selected metropolitan areas. We should expect that as the samples get smaller, the results will become more volatile. However, the consistency of pattern confirms our initial interpretations.
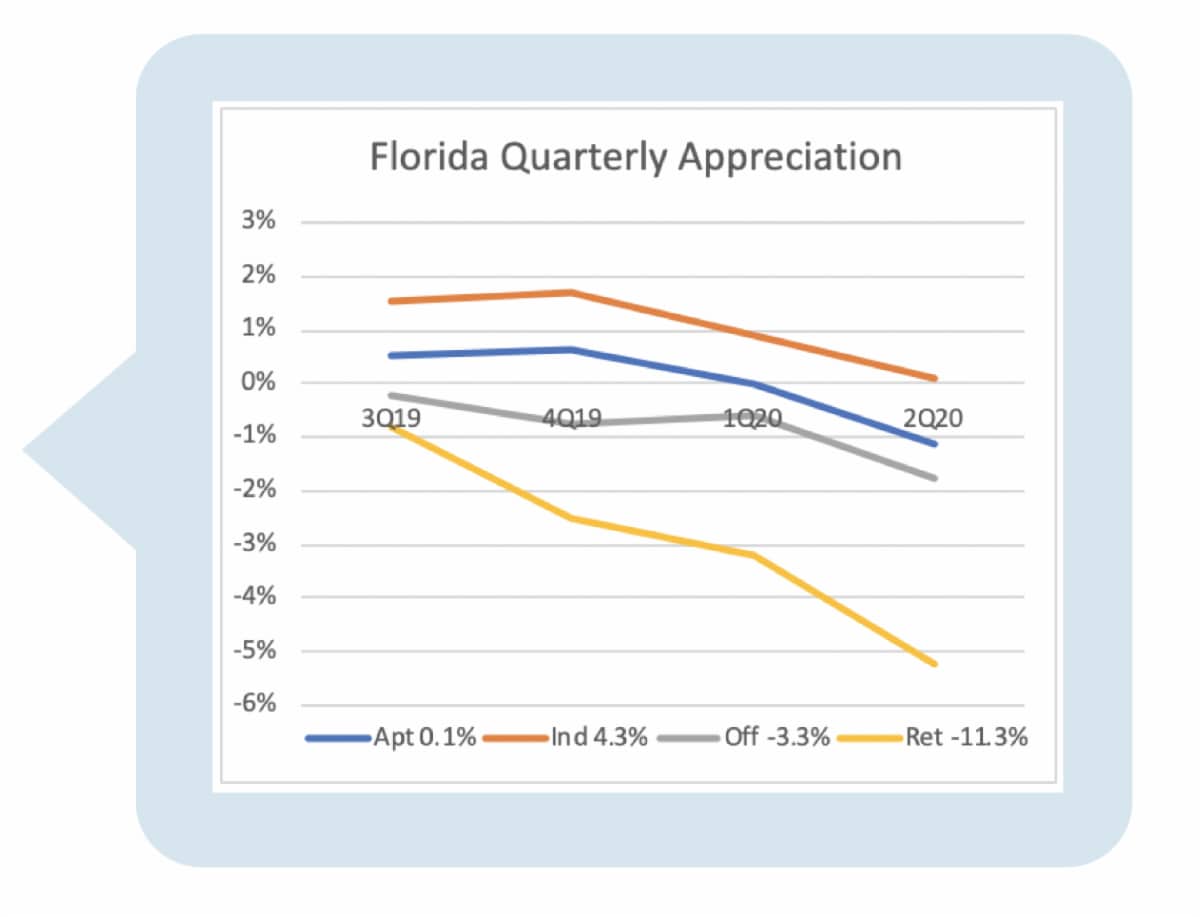
This top chart shows appreciation for all stabilized properties located in Florida that are reported to NCREIF2. If you are comparing this to the US chart in the previous paper, apartments performed better over the past year and office worse than the national level. The industrial sector in Florida appreciated a bit less than the sector at the national level but was extremely positive at 4.3% for the year. Remarkably, the retail sector had an identical level of capital return in Florida as it did across the US, with a significant 11.3% depreciation over the year. Similar to the US chart, all sectors’ appreciation in Florida fell materially during the second quarter.
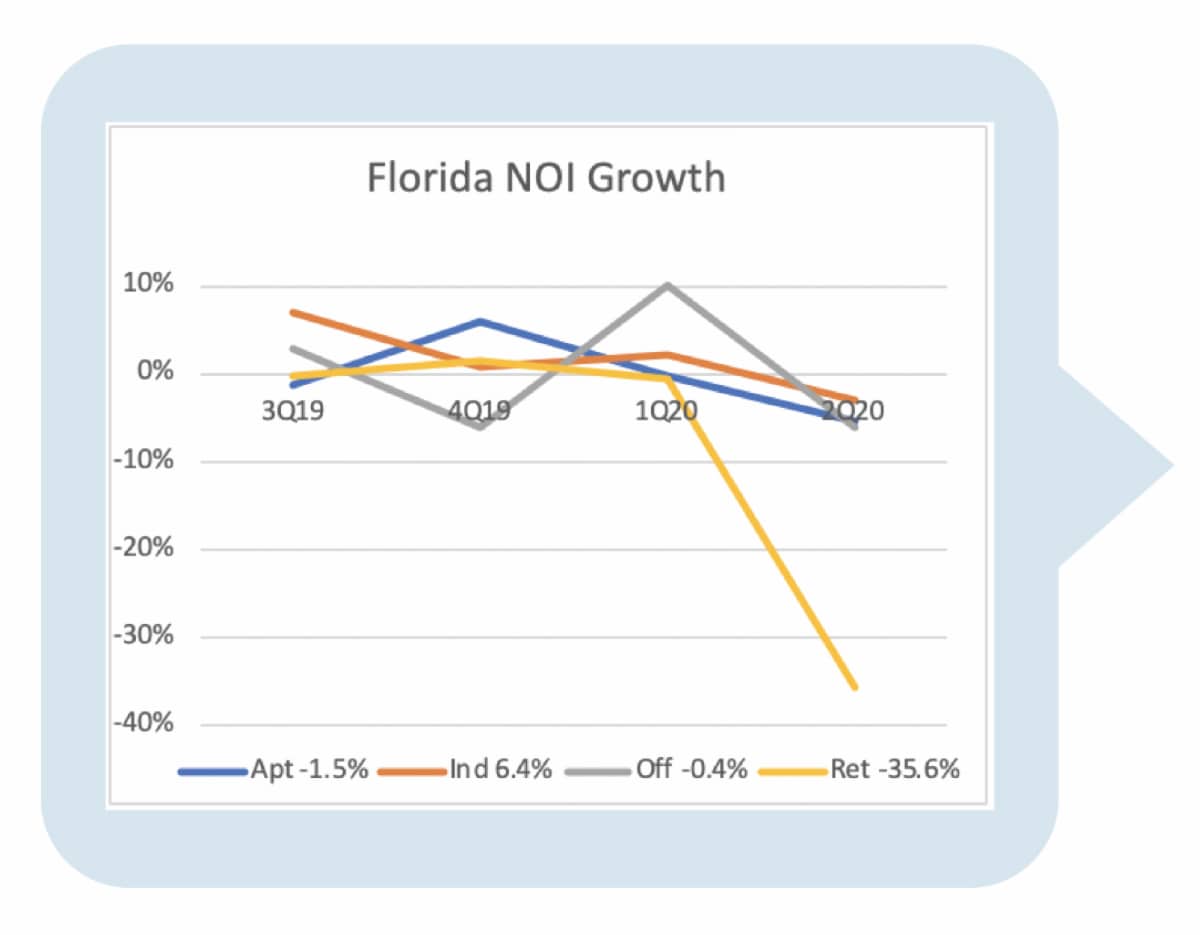
The Florida NOI Growth chart is also very similar to that of the US. In Florida, three of the four sectors showed declining NOI growth for the year, following the negative second quarter. Only the industrial sector had enough growth prior to the quarter to withstand the downturn. The retail pattern is very similar between Florida and the US, with a decline that separates it from other sectors.
A fine point is that the axis ranges in the US charts are the same as the ranges in the Florida charts, respectively. Thus, you are not being influenced by clever chart adjustments that might change the resulting shapes. It is fair to make a direct comparison between the charts.
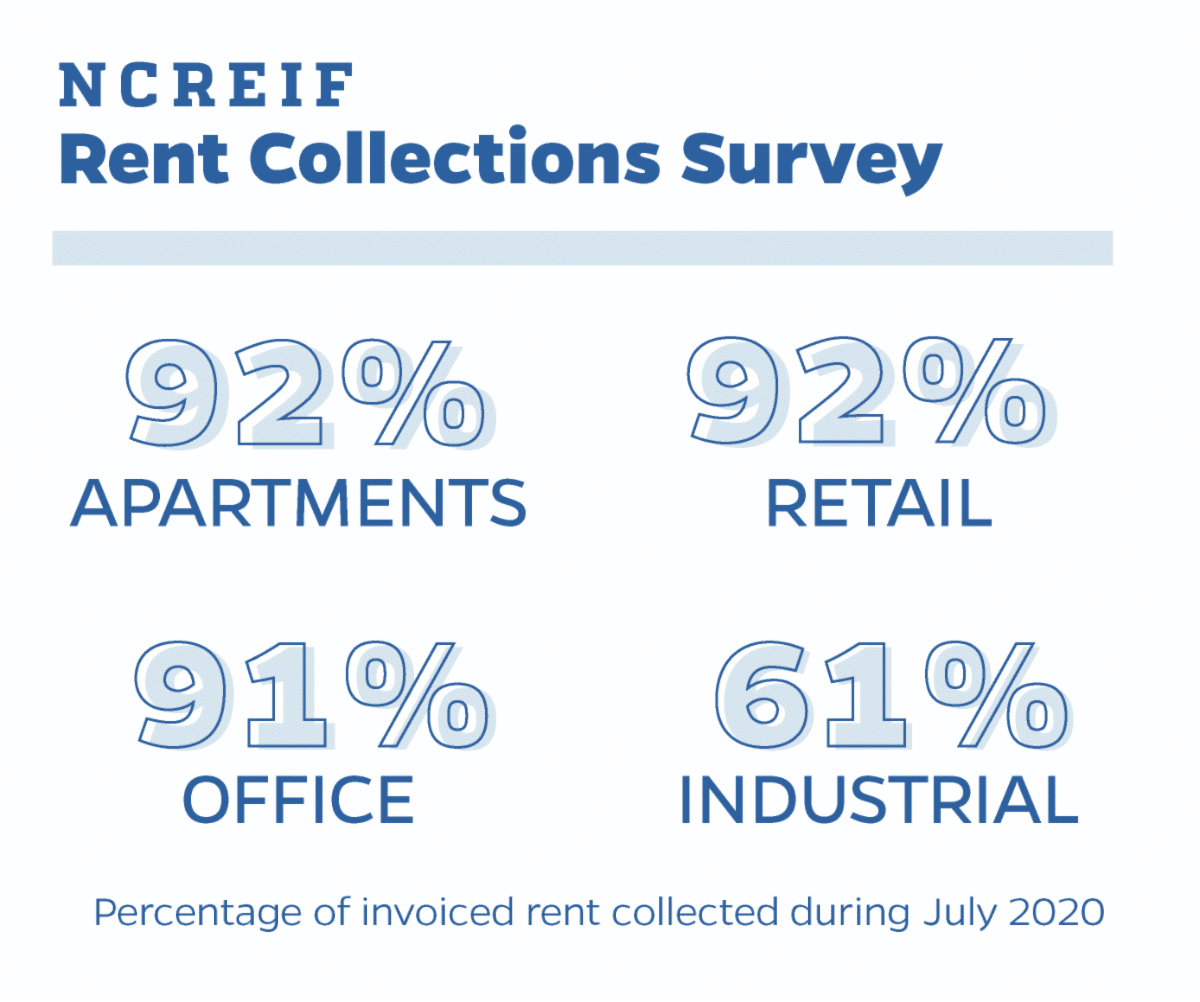
If we take the Survey Collection results at the national level and assume a similar result for Florida, we might anticipate that the NOI for the third quarter will be lower than that of the second quarter. Even after a 35% decline in NOI for the retail sector, rent collections 39% below invoice (assuming some fixed expenses) will produce a further drop. One glimmer of hope is that Florida has been relatively aggressive, compared to many other states, in reengaging its economy. It is possible that Florida is collecting more rent than these national numbers indicate.
We can drill down further into selected metro areas within Florida. Please be aware that sample size is very small for some of these data points. In fact, NCREIF has masking criteria for the release of data. If there are too few properties in a market or too few managers reporting results, they will not release information, to protect the reporting members. Thus, you will see in the following charts that some markets will be shown for one sector but not another.
The following charts are shown by single sector per chart, in order to show several metros without making a spaghetti chart. The measures are the same, but each chart shows one sector, as described in the chart title. Also, these following sector charts do not have matching axis ranges, as described for the US to Florida charts. This is not to influence your interpretation but rather to show the trend movement. A single range wide enough to capture the volatility forces many of these data into a horizontal line. Please take note of the 0% on the Y-axis to set your frame of reference.
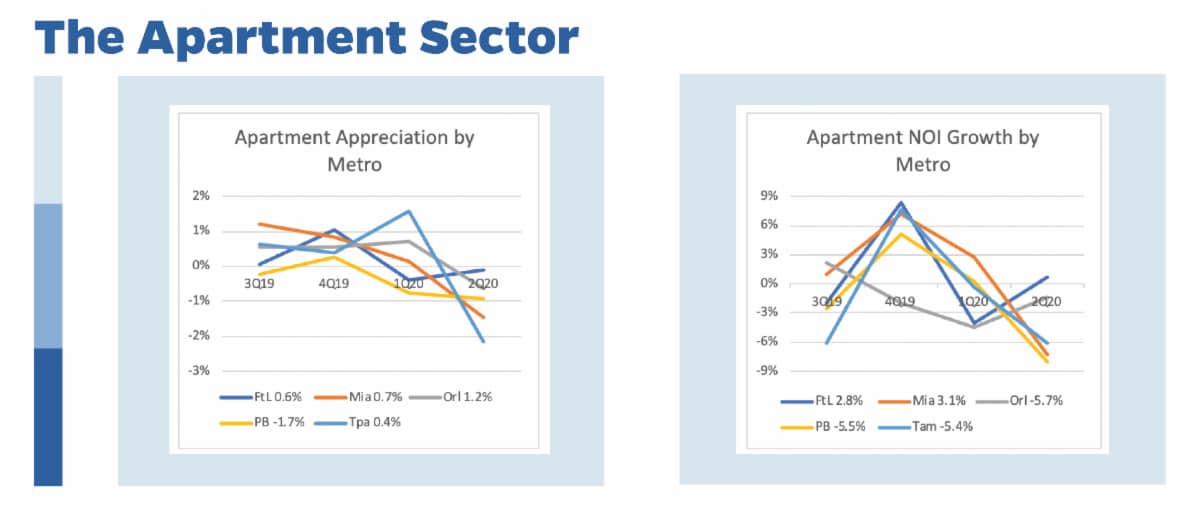
The apartment sector has the richest data availability, so five metro areas meet the masking criteria, allowing a broad cross-market comparison. The first point to notice is that the general pattern for all appreciation lines and all NOI lines is similar to the pattern established in the US and Florida charts. The timing varies slightly between the first and second quarter, but all Apartment markets suffered negative impact (in both income and value) from the virus effects.


Secondly, looking at the four-quarter cumulative effects in the legend, Palm Beach is the only market to have lost value over the entire year and this is due to weakness prior to the virus concerns. The second quarter result only magnified the softness in this market-sector. Orlando, interestingly, suffered the most negative cumulative NOI effect for the year but had the highest appreciation. This implies that the Orlando cap rate fell over the past year. A remarkable outcome, given the market uncertainty. Third quarter results will reveal if appraisers maintain their confidence in a market rebound or if the values succumb to the falling income.
The industrial charts shown below demonstrate the impact of small sample size and NOI measurement challenges in these data. There are only three Florida markets that have a rich enough sample in the NCREIF database to meet the masking criteria. Consistent with data at the national and state levels, the industrial sector has recently performed extremely well and even post-COVID returns are relatively strong. This does not relieve the sector of NOI decline and low appreciation during the second quarter. The COVID effect is strong and negative, even upon a high performing sector.
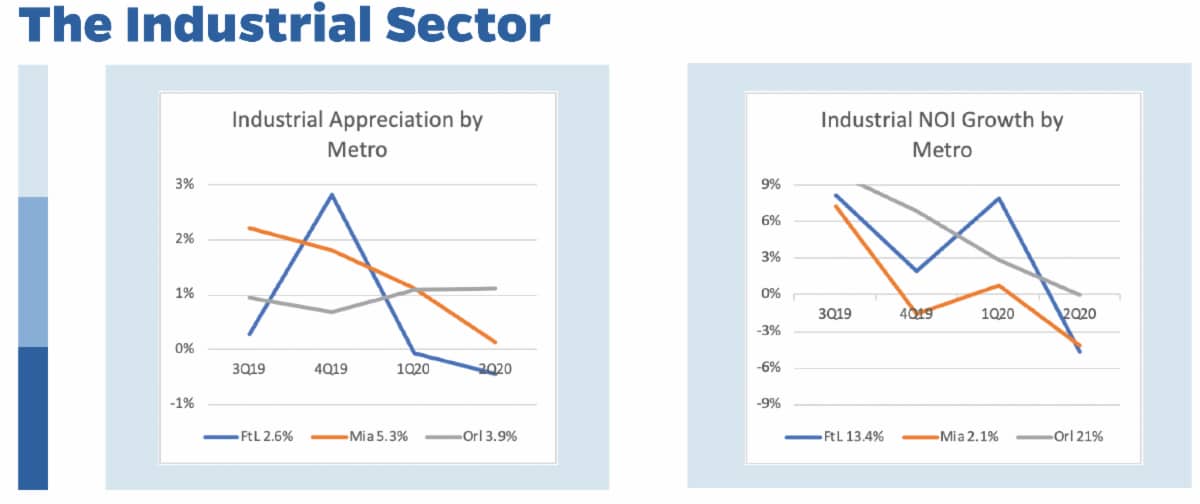
There is a lot of noise in the industrial NOI data, but it seems reasonable to interpret that the average industrial property in these cities was growing income at a high rate prior to the societal virus reaction. Seeing income growth fall so rapidly, we know that the market faced a significant shock. The corresponding appreciation reaction in Ft. Lauderdale and Miami was slightly negative, acknowledging the directional move but allowing for the opportunity of a quick recovery. Orlando appreciation has not yet recognized a negative impact, as its industrial values continue to rise. This is similar to the pattern observed in the apartment sector.
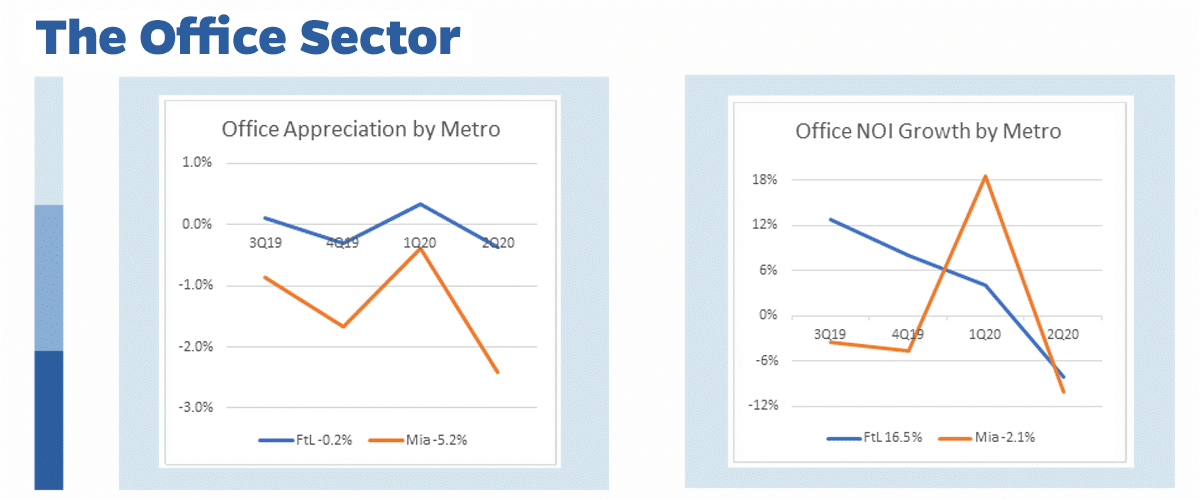
The office data are the most limited, so these charts offer results for only Ft. Lauderdale and Miami. Values were soft in Miami and the COVID issue only made matters worse. Ft. Lauderdale on the other hand seems to have held steady through the year, oscillating around the zero-appreciation level. It is not clear that the economic conditions of the second quarter had any impact at this point.
The Office Income growth chart for these two markets demonstrates some of the extreme variation we often see in the quarterly NOI data. Each market shows a quarter where it recognized significant NOI growth. This is usually balanced with a couple very low growth quarters around such a measure. The only thing notable in this chart is the coordinated plunge that each market’s NOI growth took in the 2nd Quarter.
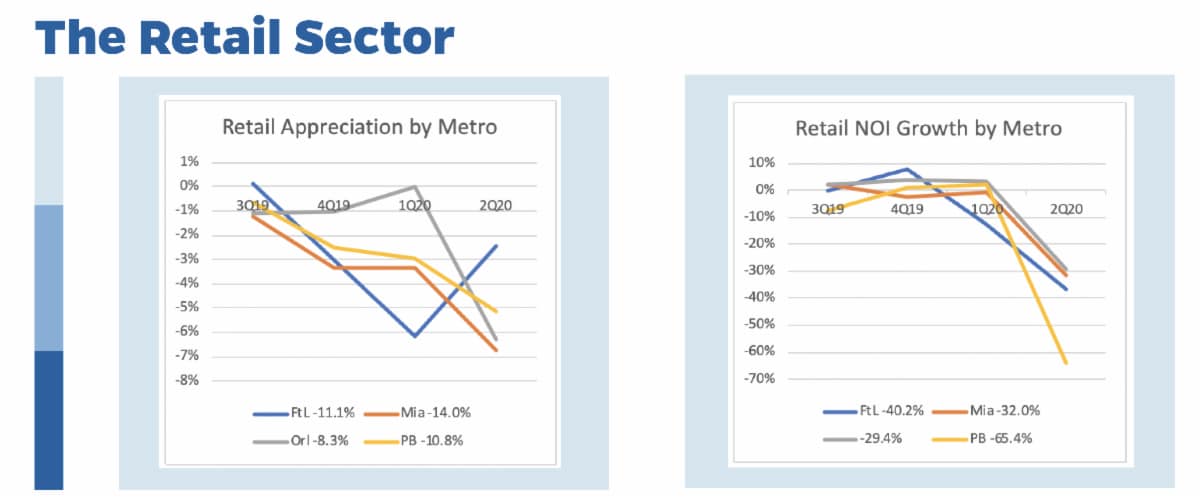
The Retail sector is the one sector that undeniably suffered in a material way from the changing business environment during second quarter. Performance in this sector went from weak to very ill.
An important component in each of these retail charts is the 0% return line. The magnitude of the scale changes dramatically between the two charts but notice that 0% is very high in each chart. This means that the data for the year are near zero or significantly negative. Also, the NOI pattern is dramatic. Income growth fell in a relatively narrow range during the first three quarters, but all metros demonstrate drastic decline in NOI during the 2nd Quarter.
The magnitude of income downturn is much greater than for the other property sectors. This is consistent with the survey data, which indicated that July revenue fell at four times the rate of other sectors. Of course, the July date indicates that the third quarter will be challenged as well. As a reminder to avoid despair, from 2012 through 2015 the Retail sector produced the highest total return of all sectors. It will adjust and perform again.
So, what should property owners do? This is always the most important and most difficult question. There are no answers in the data but here are a couple thoughts to consider. First, the current conditions are temporary. The economy is dramatically impacted by the inability for people to gather and the whole world is currently participating in reduced business activity. At some point, either after a vaccine or other spread control, the market will get back to work and companies will start competing again. Patience (and finding ways to make mortgage payments) will be rewarded.
Second thought; although current conditions are temporary, some activities may change forever. The changes to which corporations and individuals have adjusted may offer insight to another way of operating. It is unlikely that everyone will perpetually work from home or that masses will move from urban to suburban locations. However, these and other changes may happen on the margin. This is not a time to panic nor be passive. This is a time to hold assets, control expenses, search for permanent shifts and exploit the changes.
1“Initial Impact of COVID-19 on Commercial Real Estate Operations” from the Bergstrom Real Estate Center, NCREIF ODCE Fund Data as of August 2020.
2National Council of Real Estate Investment Fiduciaries – A non-profit association of private institutional real estate investors and advisors that was established in 1978.
This story was originally posted by UF Warrington College of Business.
Check out more stories about UF research on COVID-19.